ROOT tips & hacks#
ROOT is the standard analysis software used for physics analysis (and much more) in mainly particle physics and nuclear physics. This page summarizes some quick to use examples and tips.
Hacks when plotting#
While the default ROOT plotting is decent, it can definitely be upgraded to have better colour palettes and impactful plots. Below are some hacks I’ve learned in the past few years.
Custom colour palettes#
If you wish to define your own colour palette, you can do it simply do it using the instructions in the ROOT documentation.
Below is an example function (using
pyROOT) to create a few custom palettes. Note that you need to importROOT,numpyandarrayin the code.def SetPalette(name): # Define the RGB values for each color in the palette, # and in the 'length' define how to distribute the colors if name == "Yellow-Blue": colours = [[26, 73, 130], [41, 110, 179], [27, 133, 204], [227, 150, 34], [255, 230, 8]] length = [0.00, 0.25, 0.5, 0.8, 1.00] elif name == "Yellow-MildBlue": colours = [[41, 110, 179], [27, 133, 204], [227, 150, 34], [255, 230, 8]] length = [0.00, 0.25, 0.5, 1.00] elif name == "Light-Blue": colours = [[20, 51, 92], [39, 89, 156], [69, 153, 217], [94, 212, 255]] length = [0.00, 0.33, 0.67, 1.00] else: raise RuntimeError("Selected pallette " + name + "is not available") # Convert to numpy array, and transpose the array new_colours = numpy.array([[y / 255 for y in x] for x in colours]) new_colours_tp = numpy.transpose(new_colours) # Then you need to convert the array values to ctype double Red = array('d', new_colours_tp[0].astype('float')) Green = array('d', new_colours_tp[1].astype('float')) Blue = array('d', new_colours_tp[2].astype('float')) Length = array('d', numpy.array(length).astype('float')) # No need for gStyle.SetPalette(xxx) since it's automatically run with CreateGradientColorTable ROOT.TColor.CreateGradientColorTable(len(colours),Length,Red,Green,Blue,200)
Below are some examples of the palettes.
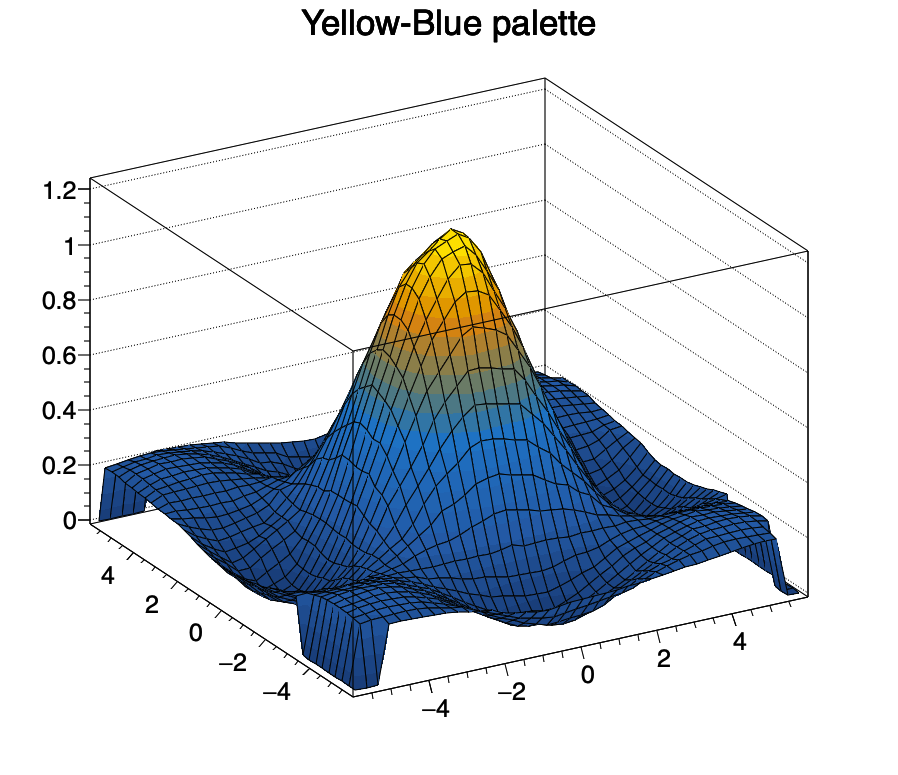 Yellow-Blue pallette
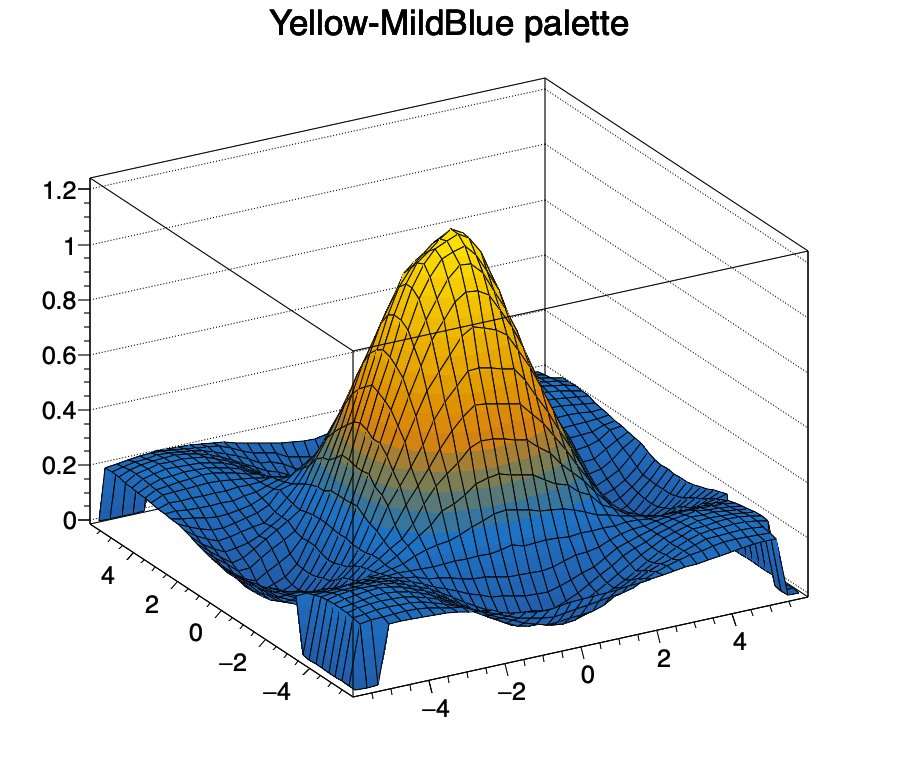 Yellow-MildBlue pallette
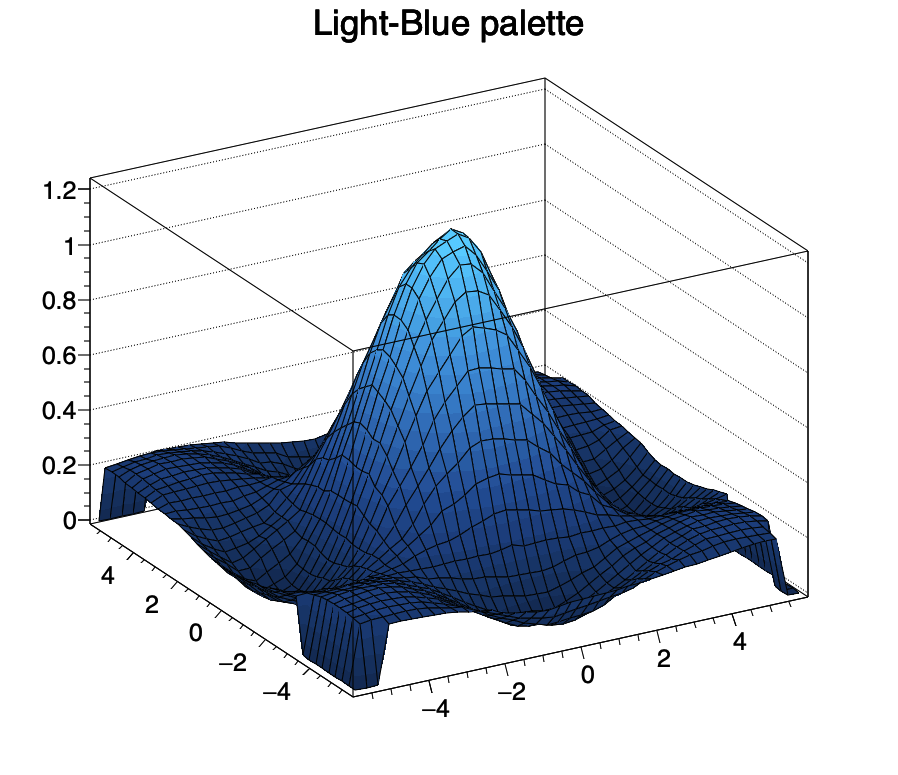 Light-Blue pallette
Command-line hacks#
To iteratively hadd histograms or trees, which are in multiple paths
<source-dir-path1>,<source-dir-path2>, etc.# Get the file names from one path array=($(ls <source-dir-path1>/tree-* | xargs -n 1 basename)); # Then go to the target directory and do, for i in ${array[@]}; do hadd "$i" <source-dir-path1>/"$i" <source-dir-path2>/"$i"; done
Some example codes#
If you wish to plot three overlayed histograms, after hadding them, in the ROOT console.
TFile *f1=TFile::Open("HistFile_G.root")
TFile *f2=TFile::Open("HistFile_D.root")
TFile *f3=TFile::Open("HistFile_T.root")

TH1F *h1 = f1->Get<TH1F>("RegionHistogram_SR_mBB")
TH1F *h2 = f2->Get<TH1F>("RegionHistogram_SR_mBB")
TH1F *h3 = f3->Get<TH1F>("RegionHistogram_SR_mBB")

TH1F *h4 = f1->Get<TH1F>("RegionHistogram_CRLow_mBB")
TH1F *h5 = f2->Get<TH1F>("RegionHistogram_CRLow_mBB")
TH1F *h6 = f3->Get<TH1F>("RegionHistogram_CRLow_mBB")

TH1F *h7 = f1->Get<TH1F>("RegionHistogram_CRHigh_mBB")
TH1F *h8 = f2->Get<TH1F>("RegionHistogram_CRHigh_mBB")
TH1F *h9 = f3->Get<TH1F>("RegionHistogram_CRHigh_mBB")

h1->Add(h4); h1->Add(h7); h2->Add(h5); h2->Add(h8); h3->Add(h6); h1->Add(h9);

h1->SetLineColor(2); h2->SetLineColor(9); h3->SetLineColor(8)
h1->Rebin(2); h2->Rebin(2); h3->Rebin(2)

h1->Draw("HIST E"); h2->Draw("HIST SAME E"); h3->Draw("HIST SAME E")
If you wish to plot plot three different histograms from different TDirectories.
TFile *f1=TFile::Open("HistFile.root")

TH1F *h1 = (TH1F*)f1->Get("Sys1/Histogram")
TH1F *h2 = (TH1F*)f2->Get("Sys2/Histogram")
TH1F *h3 = (TH1F*)f3->Get("Sys3/Histogram")

h1->SetLineColor(2); h2->SetLineColor(9); h3->SetLineColor(8)

h1->Draw("HIST E"); h2->Draw("HIST SAME E"); h3->Draw("HIST SAME E")